AARP Hearing Center
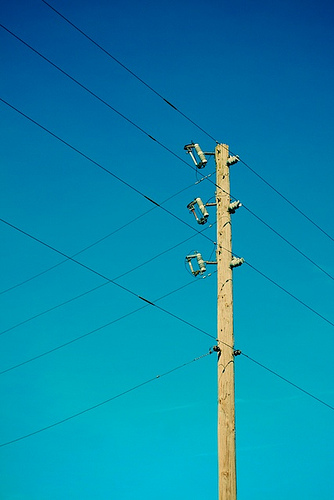
We're deep into the winter weather season and that reminds us to prepare for power disruptions. Tell us how past power outages - whether recent outages or from storms which happened as long ago as Snowmageddon - impacted you and your family by commenting to this article.
Your personal story will give life to the statistics below, which are from an AARP research study conducted in the District.
SURVEY OF DISTRICT OF COLUMBIA
RESIDENTS AGE 50 AND OLDER ABOUT UTILITIES
AARP’s District of Columbia State Office in response to its commitment to ensure affordable electric rates and consumer protections for all residents commissioned this survey to explore the views of 50+ residents regarding utility affordability, smart meters, power restoration following storms and consumer protections.
These results are based on a telephone survey of District of Columbia residents age 50+ fielded March 15 to March 23, 2012. A total of 800 interviews were completed yielding a margin of error of ±3.5 percent.
SURVEY RESULTS-IN-BRIEF
- One-half of District of Columbia residents 50+ are concerned about the rising costs of heating and cooling their homes and nearly the same percentage think they are currently paying too much for electricity.
- 50 percent say they are extremely or very concerned about the rising costs of heating and cooling their homes; and another 24 percent say they are somewhat concerned. In fact, only 23 percent say they are not very or not at all concerned.
- 43 percent say it is at least somewhat difficult to pay their electric and gas bill.
- 48 percent say they are paying too much for electricity.
- 51 percent say the District of Columbia government is not doing enough to help people affected by rising electricity costs. Nor do they believe that the interests of residential utility customers are represented and taken into consideration when rate increases are proposed.
- Pepco has installed smart meters in all homes in the District of Columbia. With smart meters, Pepco can remotely connect or disconnect service. Currently, Pepco cannot remotely disconnect service for non-payment. This is overwhelmingly supported by the District of Columbia residents.
- Most residents (65%) are aware that smart meters haven been installed in District of Columbia homes.
- Three-fourths (78%) somewhat or strongly oppose the utility company disconnecting service without a home visit to notify the customer.
- Now that the smart meters have been installed, Pepco can offer pricing plans which typically charge higher rates for electricity used during peak usage times. District of Columbia residents age 50+ oppose making time of use rate plans mandatory.
- 58 percent somewhat or strongly oppose making time of use rate plans mandatory.
- 24 percent strongly or somewhat support time of use rate plans mandatory.
- Pepco has asked for a $39.7 million rate increase, plus an additional surcharge on electric bills to improve reliability and to replace aging technology. Most District of Columbia residents age 50+ oppose this proposed increase and surcharge.
- 64 percent of respondents say they somewhat or strongly oppose a rate increase along with the additional surcharge.
- 21 percent of residents support a rate increase along with the additional surcharge.
METHODOLOGY
The AARP Utility Survey was conducted as a telephone survey among 50+ residents in the District of Columbia. The survey examined public opinion about utility rates and services in the District of Columbia. The interviews were conducted in English by Precision Opinion from March 15 to March 23, 2012. The sample was weighted by residents age 50+. The margin of error for the random sample of 800 for the District of Columbia is +/-3.5%.
Response, Cooperation, and Refusal Rates
The response rate for this study was measured using AAPOR’s response rate 3 method. The cooperation rate was measured using AAPOR’s cooperation rate 3 method. The refusal rate was measured using AAPOR’s refusal rate 3 method. The table below contains these rates.
Response Rate: 40.2% Cooperation Rate: 91% Refusal Rate: .044%
Source: AAPOR Outcome Rate Calculator Version 2.1 May 2003
Photo By Jim Rhoades


