

AARP Hearing Center


AdrlnJunkie/Getty Images
Summary of Key Findings
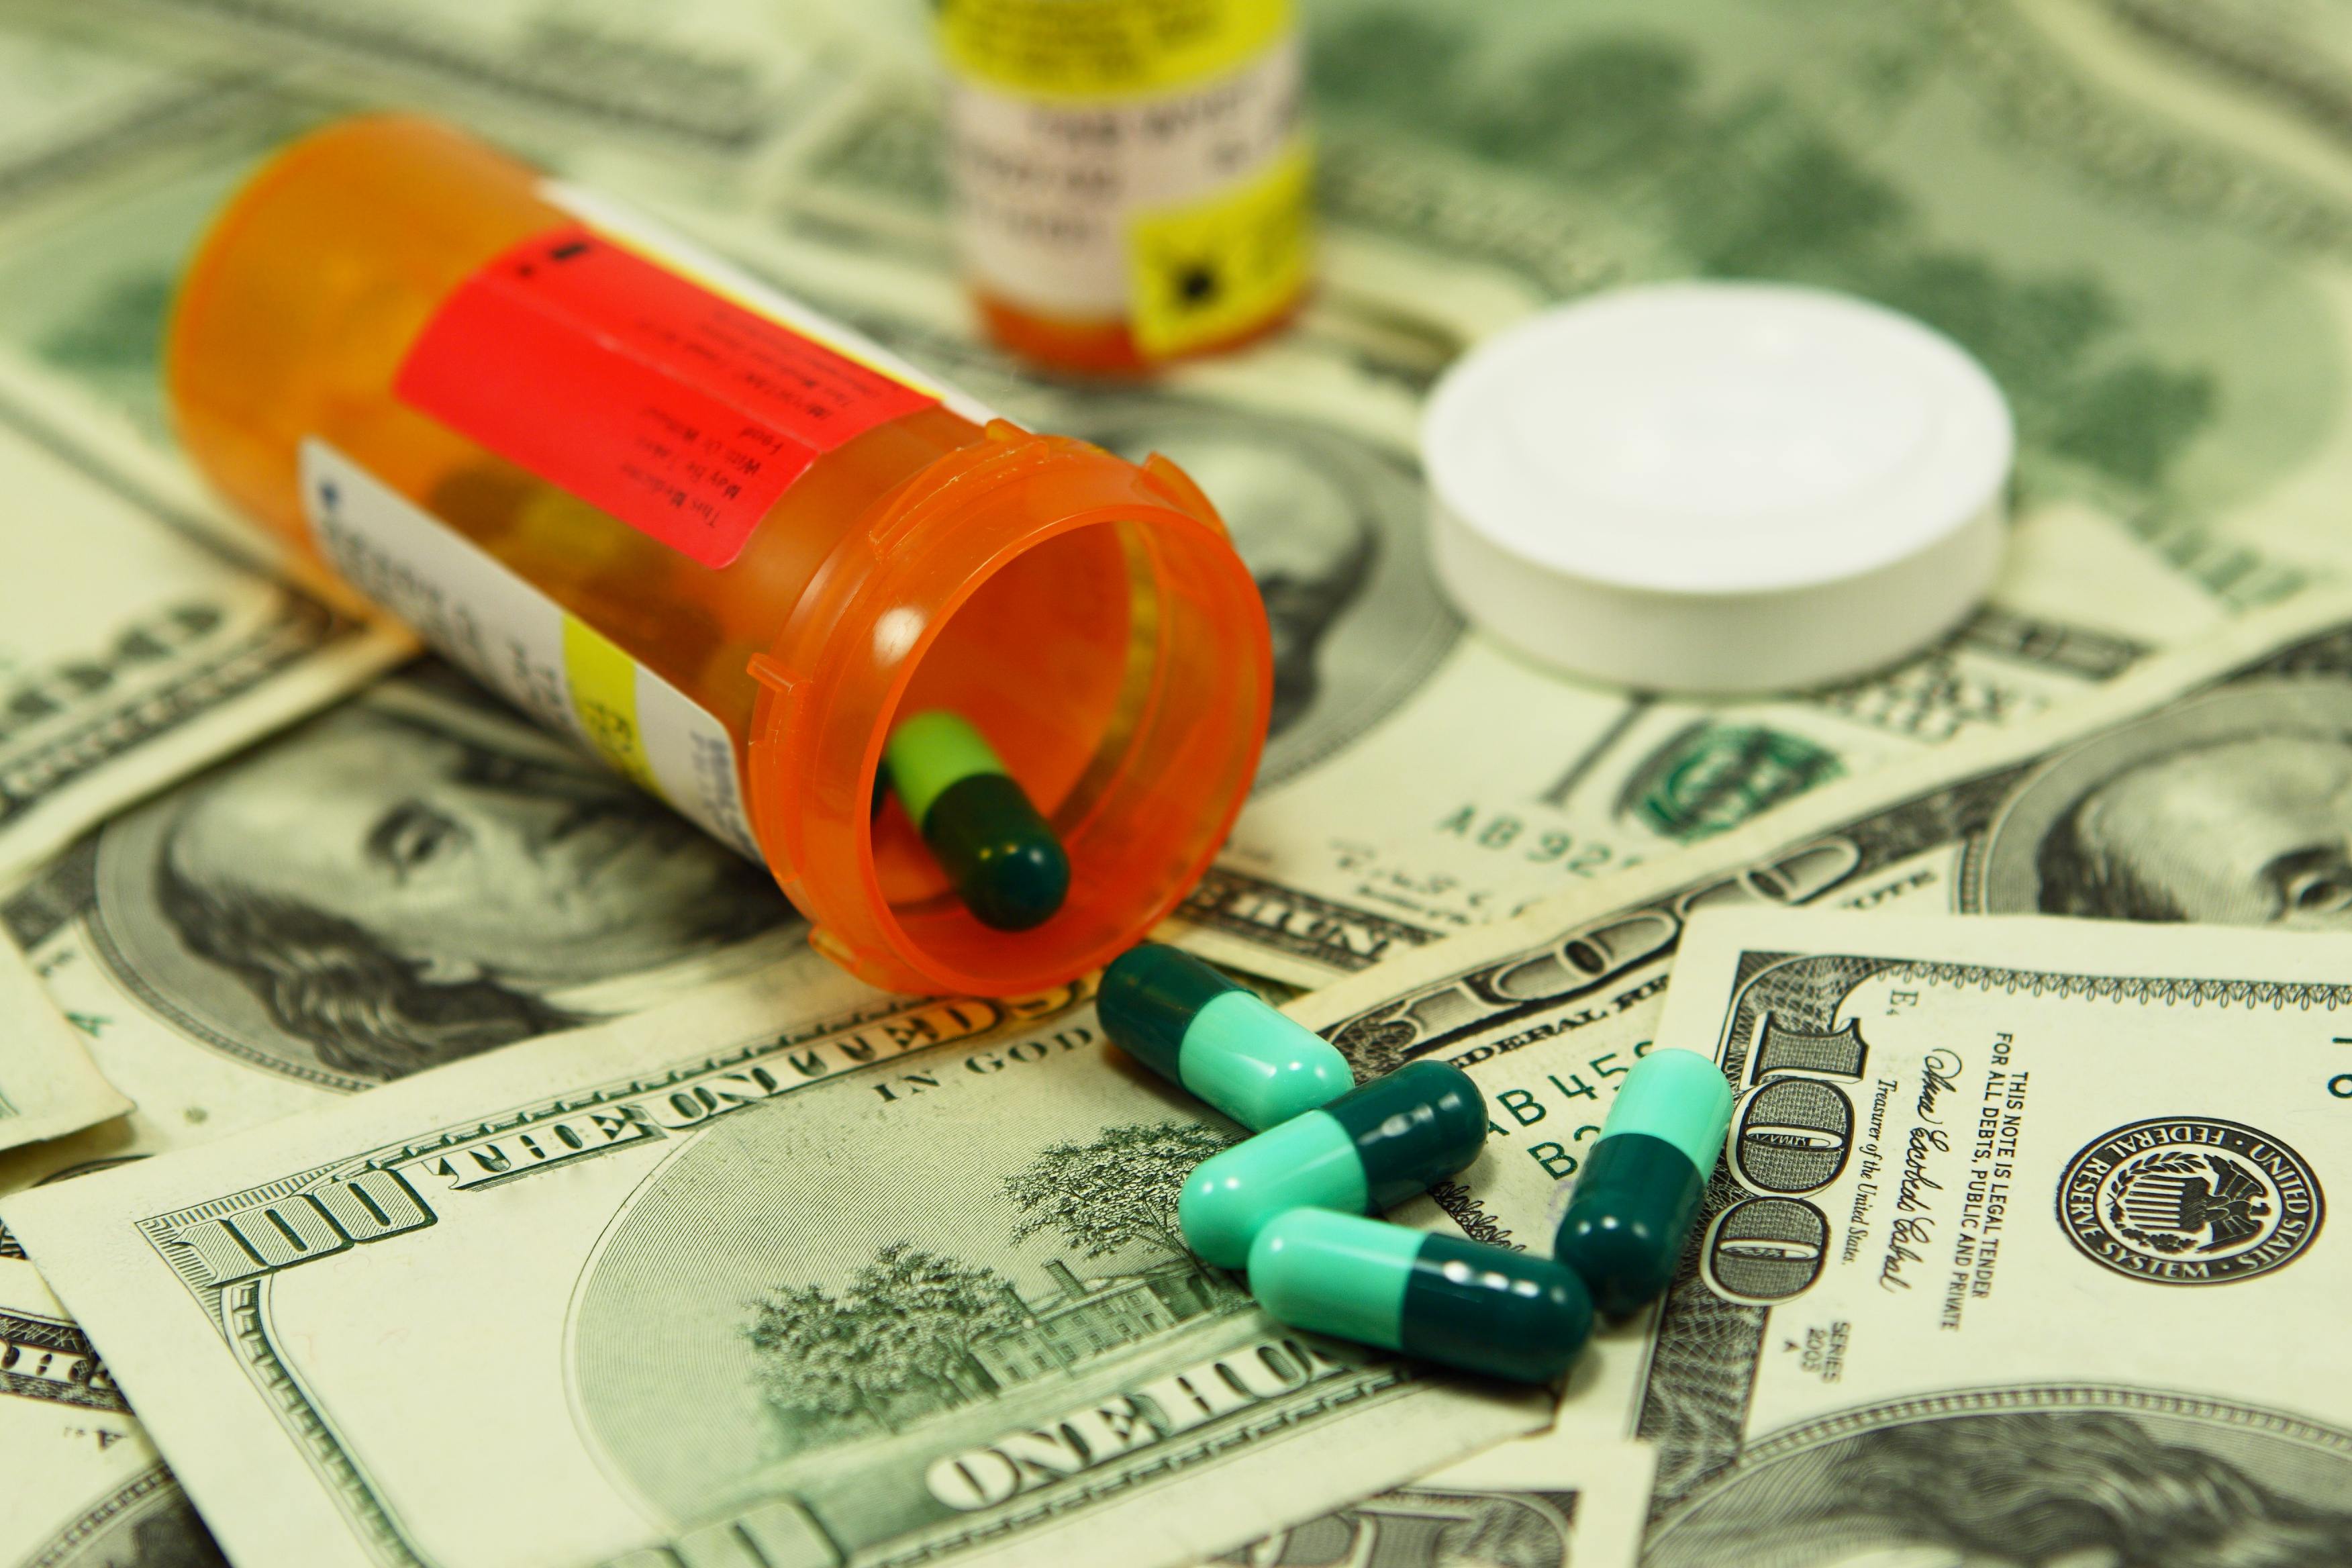
Nearly two out of three (62%) likely Virginia voters say they are concerned about being able to afford the cost of prescription medication for themselves or a family member. Women (66%), voters between the ages of 50-64 (67%), and Virginians in the South/Southwest region (71%) show the highest levels of concern.
Likely Virginia voters support a proposal to create a prescription drug affordability board that could set limits on how much some people would pay for prescription medications (58% support to 16% oppose). Support for this proposal is consistent among voters in urban, suburban and rural communities. This proposal is notably more popular among Hispanic (82%) and Black (73%) voters, as well as voters ages 18-49 (63%).
Support for joining a buying pool with other states to engage in bulk purchasing of prescription drugs ranges between 76% and 78% across all regions of the Commonwealth and across all age groups, with slightly greater support among voters age 50-64 (82%). Support for joining a buying pool crosses the ideological spectrum, with liberals showing the highest levels of support (89%), followed by moderates (81%) and conservatives (67%).
Survey of 800 Virginia Registered Likely Voters Age 18+ conducted by Wason Center for Civic Leadership at Christopher Newport University on behalf of AARP, August 15-23, 2021. Margin of error +/-3.6%
Prescription Drug Questions
1. Do you currently take prescription medication on a regular basis, for example daily, weekly, or monthly?
| Total (%) | 18-49 (%) | 50-64 (%) | 65+ (%) | |
| n | 799 | 283 | 217 | 299 |
| Yes | 70 | 55 | 71 | 83 |
| No | 28 | 42 | 28 | 14 |
| Don’t Know | 2 | 3 | 1 | 3 |
2. In the last two years, did you ever decide not to fill a prescription that your doctor had given you?
| Total (%) | 18-49 (%) | 50-64 (%) | 65+ (%) | |
| N | 800 | 283 | 217 | 300 |
| Yes | 24 | 28 | 25 | 19 |
| No | 74 | 70 | 74 | 79 |
| Don’t Know | 2 | 3 | 1 | 2 |
3. Thinking about the next few years, how concerned are you about being able to afford the cost of prescription medication you or a family member may need?
| Total (%) | 18-49 (%) | 50-64 (%) | 65+ (%) | |
| n | 800 | 283 | 217 | 300 |
| Very concerned | 36 | 36 | 39 | 32 |
| Somewhat concerned | 26 | 21 | 26 | 29 |
| Not too concerned | 16 | 17 | 16 | 15 |
| Not at all concerned | 23 | 26 | 18 | 23 |
| Don’t Know | 0 | 0 | 0 | 0 |
4. The following are proposals that have been made to lower the prices of prescription drugs. Please indicate whether you support or oppose each proposal. If you are unsure, please say that.
- A. Create a prescription drug affordability board to help reduce the price that consumers pay for drugs in Virginia. The board would evaluate drug prices and set limits on how much certain payers, such as state agencies, will pay for prescription medications.
| Total (%) | 18-49 (%) | 50-64 (%) | 65+ (%) | |
| n | 802 | 284 | 218 | 300 |
| Support | 58 | 63 | 58 | 54 |
| Oppose | 16 | 17 | 15 | 16 |
| Unsure | 24 | 18 | 26 | 24 |
| Don’t Know | 2 | 1 | 1 | 2 |
- B. Having the Commonwealth of Virginia join prescription drug buying pools with other states so they can offer lower prices of prescription drugs through bulk purchasing.
| Total (%) | 18-49 (%) | 50-64 (%) | 65+ (%) | |
| n | 801 | 284 | 217 | 300 |
| Support | 77 | 74 | 82 | 76 |
| Oppose | 8 | 11 | 6 | 7 |
| Unsure | 14 | 14 | 12 | 16 |
| Don’t Know | 1 | 1 | 0 | 2 |
- C. Allowing states to import prescription drugs from wholesalers and licensed pharmacies operating in Canada and other countries that have equivalent safety and quality standards to the United States.
| Total (%) | 18-49 (%) | 50-64 (%) | 65+ (%) | |
| n | 801 | 283 | 218 | 300 |
| Support | 67 | 72 | 70 | 60 |
| Oppose | 17 | 13 | 18 | 19 |
| Unsure | 15 | 15 | 12 | 18 |
| Don’t Know | 1 | 1 | 1 | 3 |
Demographics
EDUC: Could you tell me the highest level of school or college you had the opportunity to complete:
High school or less 15
Vo-Tech 6
Some college 28
College or more 49
HISPANIC: Do you consider yourself to be Hispanic or Latino?
Yes 4
No 94
Dk/ref (vol) 2
RACE: Do you consider yourself to be:
White 69
Black or African American 20
Other 11
RELIG: What is your religious preference, are you Protestant, Roman Catholic, Jewish, another religion, or no religion?
Protestant 41
Christian (non-specific) 12
Catholic 13
Jewish 1
Other 6
None 21
Dk/ref (vol) 5
IDEOL: When it comes to your ideology, would you consider yourself to be…
Very conservative 9
Conservative 17
Moderate 33
Liberal 25
Very liberal 11
Dk/ref(vol) 5
PARTY: In politics today, do you generally consider yourself to be a Republican, a Democrat, or an Independent?
Republican 28
Democrat 37
Independent 32
No Preference/party (vol) 4
Dk/Ref (vol) 3
PARTYLN
Lean Republican 39
Lean Democrat 34
Independent 17
Dk/ref (vol) 10
AGE: (Recorded as exact year of birth)
18-24 4
25-34 8
35-44 18
45-54 14
55 & older 56
INCOME: And, just for statistical purposes, in which of the following categories does your family income fall?
Under $25,000 5
$25-$49,999 16
$50-$74,999 16
$75-$99,999 17
$100,000-$149,999 17
Over $150,000 17
Dk/ref (vol) 12
CELL/LANDLINE
Cell 35
Landline 65
SEX:
Male 49
Female 51
REGION
Northern Virginia 32
Richmond-Central 24
Hampton Roads-East 24
South/Southwest/West 21
Methodology
The results of this poll are based on 800 interviews of registered Virginia voters who are likely general election voters, including 277 on landline and 523 on cell phone, conducted August 15-23, 2021. A likely general election voter is one who has voted in at least two of the last four general elections or is newly registered in the last 12 months and indicates they are enthusiastic and plan to vote in the upcoming November 2 election. The margin of error for the whole survey is +/-3.6% at the 95% level of confidence. This means that if 50% of respondents indicate a topline view on an issue, we can be 95% confident that the population’s view on that issue is somewhere between 46.4% and 53.6%. The margin of error for subgroups may be higher. All error margins have been adjusted to account for the survey’s design effect, which is 1.1 in this survey. The design effect is a factor representing the survey’s deviation from a simple random sample and takes into account decreases in precision due to sample design and weighting procedures. In addition to sampling error, the other potential sources of error include non-response, question wording, and interviewer error. Percentages may not equal 100 due to rounding. The response rate (AAPOR RRI Standard Definition) for the survey was 12%. Five callbacks were employed in the fielding process. Live calling was conducted by Dynata. The data reported here are weighted using an iterative weighting process on region, age, race, sex, and education to reflect as closely as possible the population of Virginia’s November 2, 2021 electorate.
The results of this poll are based on 800 interviews of registered Virginia voters who are likely general election voters, including 277 on landline and 523 on cell phone, conducted August 15-23, 2021. A likely general election voter is one who has voted in at least two of the last four general elections or is newly registered in the last 12 months and indicates they are enthusiastic and plan to vote in the upcoming November 2 election. The margin of error for the whole survey is +/-3.6% at the 95% level of confidence. This means that if 50% of respondents indicate a topline view on an issue, we can be 95% confident that the population’s view on that issue is somewhere between 46.4% and 53.6%. The margin of error for subgroups may be higher. All error margins have been adjusted to account for the survey’s design effect, which is 1.1 in this survey. The design effect is a factor representing the survey’s deviation from a simple random sample and takes into account decreases in precision due to sample design and weighting procedures. In addition to sampling error, the other potential sources of error include non-response, question wording, and interviewer error. Percentages may not equal 100 due to rounding. The response rate (AAPOR RRI Standard Definition) for the survey was 12%. Five callbacks were employed in the fielding process. Live calling was conducted by Dynata. The data reported here are weighted using an iterative weighting process on region, age, race, sex, and education to reflect as closely as possible the population of Virginia’s November 2, 2021 electorate.
AARP.ORG/RESEARCH | © 2021 AARP ALL RIGHTS RESERVED
About AARP Virginia
Contact information and more from your state office. Learn what we are doing to champion social change and help you live your best life.