

AARP Hearing Center


Summary of Key Findings
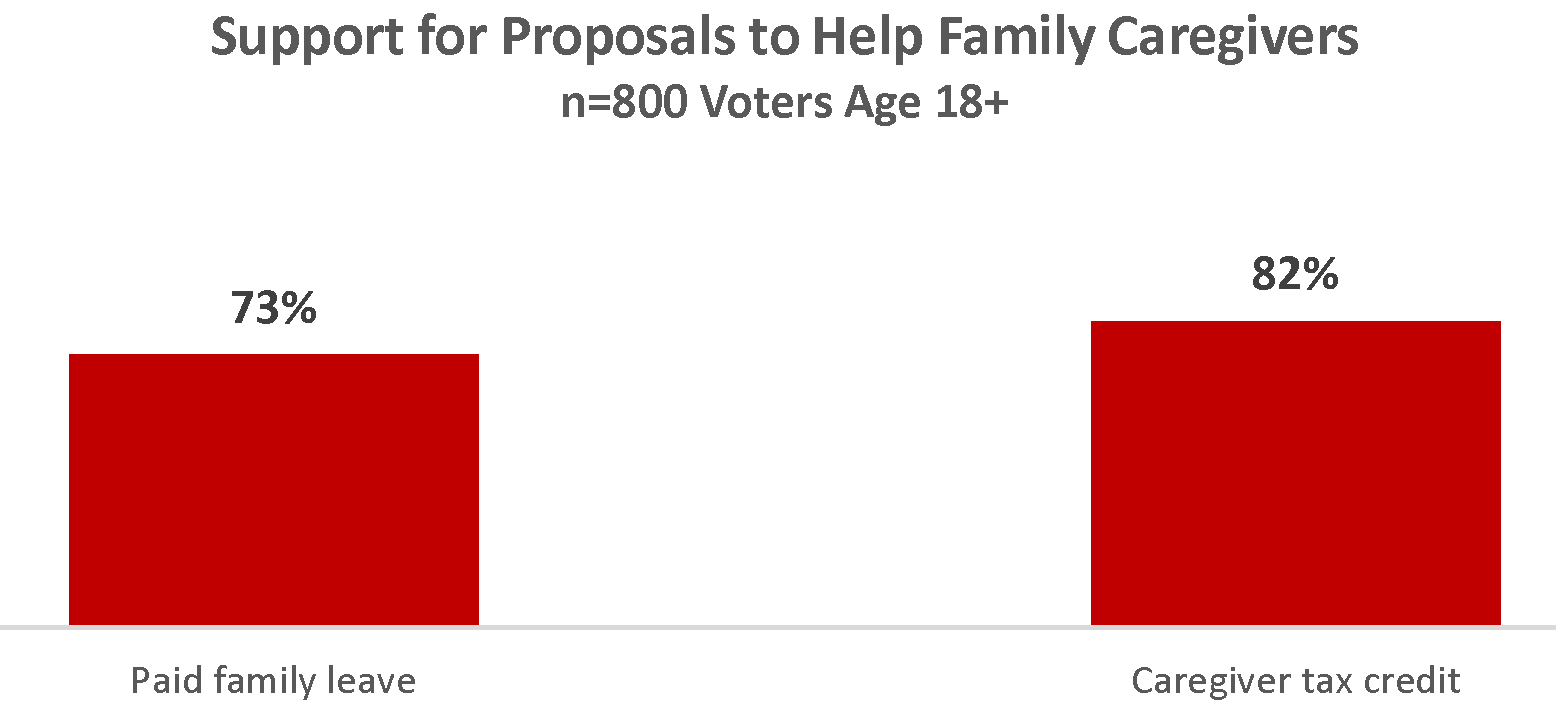
In this survey of likely voters 18+ in Virginia, nearly half report they are currently a family caregiver or have been in the past. Individuals age 50-64 are the most likely to have been a caregiver at some point in their lives (58%). Given the prevalence of family caregivers in Virginia, the challenges these individuals take on to care for their loved ones are widely known. To support caregivers, voters expressed overwhelming (73%) support for providing workers with paid family leave to care for a family member with a serious health condition, and 82% saying they support a tax credit for family caregivers in order to help offset the expenses they pay in caring for their loved ones.
Strong majorities of liberals (89%), moderates (74%), and conservatives (61%) support paid family leave for caregivers. Support is highest among women (79%) and younger voters (77%).
With even higher levels of agreement, the proposed family caregiver tax credit is supported by more than three-in-four conservatives (77%). Support is nearly identical among voters in urban (80%), suburban (82%) and rural (82%) communities.
Family Caregiver Questions
1. A family caregiver is someone who provides unpaid care for an adult loved one that cannot fully care for themselves. Assistance may include personal care, household chores, shopping, transportation, or managing finances or medical care. Are you now or have you ever been a family caregiver who provided unpaid care to an adult loved one?
| Total (%) | 18-49 (%) | 50-64 (%) | 65+ (%) | |
| n | 800 | 283 | 217 | 300 |
| Yes, I am currently a family caregiver | 14 | 12 | 21 | 11 |
| Yes, I have been a family caregiver in the past | 31 | 20 | 37 | 37 |
| No | 54 | 67 | 42 | 50 |
| Don’t Know | 2 | 1 | 0 | 3 |
- 2. Now, thinking about family caregivers, please indicate whether you support or oppose each of the following proposals. If you are unsure, please say that.
A. Providing workers with paid family leave to care for a family member with a serious health condition
| Total (%) | 18-49 (%) | 50-64 (%) | 65+ (%) | |
| n | 800 | 283 | 217 | 300 |
| Support | 73 | 77 | 77 | 64 |
| Oppose | 16 | 16 | 10 | 19 |
| Unsure | 11 | 6 | 12 | 16 |
| Don’t Know | 1 | 0 | 0 | 1 |
B. Providing a tax credit to eligible family caregivers in order to help offset the expenses they pay in caring for their loved ones
| Total (%) | 18-49 (%) | 50-64 (%) | 65+ (%) | |
| n | 801 | 283 | 217 | 300 |
| Support | 82 | 77 | 85 | 83 |
| Oppose | 9 | 9 | 8 | 9 |
| Unsure | 10 | 14 | 6 | 8 |
| Don’t Know | 0 | 0 | 0 | 1 |
Demographics
EDUC: Could you tell me the highest level of school or college you had the opportunity to complete:
High school or less 15
Vo-Tech 6
Some college 28
College or more 49
HISPANIC: Do you consider yourself to be Hispanic or Latino?
Yes 4
No 94
Dk/ref (vol) 2
RACE: Do you consider yourself to be:
White 69
Black or African American 20
Other 11
RELIG: What is your religious preference, are you Protestant, Roman Catholic, Jewish, another religion, or no religion?
Protestant 41
Christian (non-specific) 12
Catholic 13
Jewish 1
Other 6
None 21
Dk/ref (vol) 5
IDEOL: When it comes to your ideology, would you consider yourself to be…
Very conservative 9
Conservative 17
Moderate 33
Liberal 25
Very liberal 11
Dk/ref(vol) 5
PARTY: In politics today, do you generally consider yourself to be a Republican, a Democrat, or an Independent?
Republican 28
Democrat 37
Independent 32
No Preference/party (vol) 4
Dk/Ref (vol) 3
About AARP Virginia
Contact information and more from your state office. Learn what we are doing to champion social change and help you live your best life.