

AARP Hearing Center


AARP recently released an economic analysis, compiled by Oxford Economics, which sought to quantify the economic impact of American consumers over the age of 50 years of age. Dubbed the "Longevity Economy" the report looks at the sum of all economic activity serving the needs of Americans over 50 and including both the products and services they purchase directly and the further economic activity this spending generates.
Boffeli, Seth
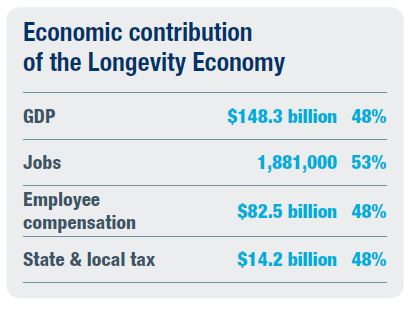
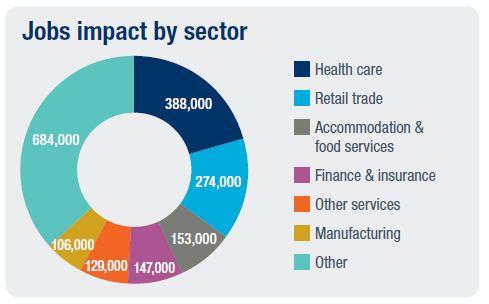
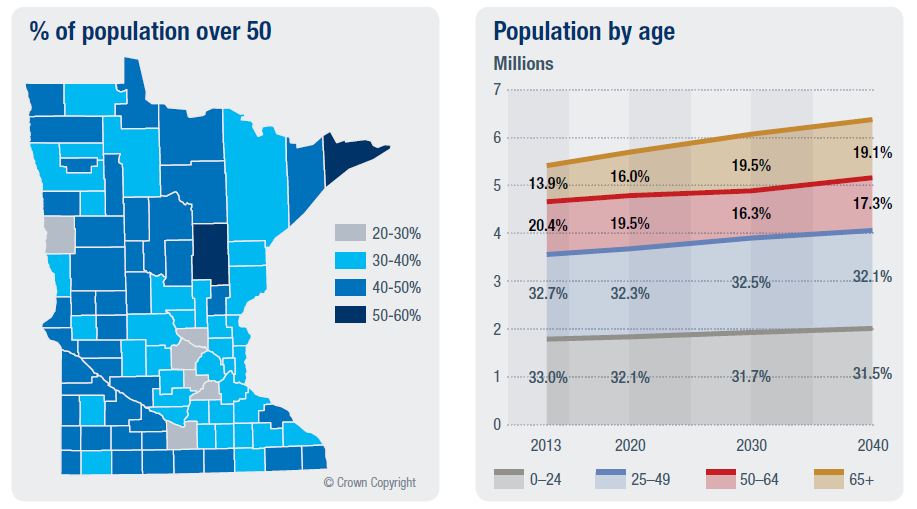
In Minnesota, people over 50 contribute to the economy in a positive, outsize proportion to their share of the population. Despite being 34% of Minnesota’s population in 2013 (expected to grow to 36% by 2040), the total economic contribution of the Longevity Economy accounted for 48% of Minnesota’s GDP ($148 billion). This supported 53% of Minnesota’s jobs (1.9 million), 48% of employee compensation ($83 billion), and 48% of state taxes ($14 billion). The greatest number of jobs supported by the Longevity Economy were in health care (388,000), retail trade (274,000), and accommodation & food services (153,000).
This $148 billion impact of the Longevity Economy was driven by $95 billion in consumer spending by over-50 households in Minnesota, or 55% of total comparable consumer spending. The categories where Longevity Economy spending accounted for the largest share of total consumer spending were health care (67%), other nondurables (60%), and financial services (58%).
People over 50 also make a significant contribution to Minnesota’s workforce, with 74% of people 50-64 employed, compared to 84% of people 25-49. Overall, people over 50 represent 33% of Minnesota’s workforce. Among employed people, 13% of those 50-64 are self-employed entrepreneurs, compared with 9% of those 25-49. Additionally, 45% of those 50-64 work in professional occupations, compared to 46% 25-49.
By the year 2032 older workers and retirees are expected to account for more than half of US GDP.
Sources
Total population by age is from the Census 2013 population estimates. Population forecasts are from the Weldon Cooper Center for Public Service. County-level age distribution, labor force status, and occupation are from the 2012 American Community Survey. Consumer spending by age group is calculated for 2013 by Oxford Economics based on data from BEA Personal Consumption Expenditures, the BEA experimental state-level PCE series, and the BLS Consumer Expenditure Survey. The economic contribution of the Longevity Economy for 2013 is calculated by Oxford Economics using IMPLAN software. Benchmark statewide totals are from IMPLAN and relevant BEA NIPA tables.
Boffeli, Seth
Boffeli, Seth

Boffeli, Seth

Boffeli, Seth
Contact AARP Minnesota
Contact information and more from your state office. Learn what we are doing to champion social change and help you live your best life.